
How to Use Interactive Infographics to Drive Engagement and Better Data Storytelling
An interactive infographic is a web-based visual experience that responds to user actions like clicking, hovering, or scrolling. Unlike static images, these modules allow users to explore data at their own pace, which significantly improves information retention and dwell time. By 2026, these tools have become essential for combating "scroll fatigue" and are widely regarded as a top-tier method for presenting complex datasets in marketing, education, and corporate training.
What Makes an Infographic Truly Interactive?
In the modern digital landscape, the term "infographic" has evolved far beyond the static long-form JPEG. An interactive infographic is a dynamic, browser-based story that utilizes HTML5, CSS3, and often JavaScript to create a two-way dialogue between the content and the reader. According to industry standards from platforms like Maglr , the defining characteristic is user agency.
Many creators confuse animation with interactivity. If a graphic moves on its own—like a GIF or a video—it is animated, but not necessarily interactive. True interactivity requires a trigger and a response. When a user hovers over a map and a tooltip appears, or when they click a button to filter a chart, they are actively participating in the data storytelling process. This "control factor" is what separates a passive viewer from an active participant.
Core Interactive Elements
- Clickable Hotspots: Invisible or highlighted areas that trigger pop-ups, external links, or navigation changes.
- Hover-to-Reveal Effects: Providing additional context without cluttering the initial view, essential for maintaining a clean aesthetic.
- Branching Paths: Allowing users to choose their own journey through the data, often used in "Choose Your Own Adventure" style narratives.
- Scrolling Triggers (Scrollytelling): Visual elements that transform or animate based on the user's scroll depth, creating an immersive flow.
As of 2026, the shift toward these formats is driven by the accessibility of no-code tools. Previously, creating such experiences required a dedicated web development team. Today, designers can use specialized platforms to build high-end experiences that are fully responsive and indexable by search engines.
Image source: Venngage
Why Your Audience Ignores Static Content and Craves Interactivity
The average digital consumer is bombarded with thousands of marketing messages daily. This has led to a phenomenon known as "scroll fatigue," where users reflexively bypass static blocks of text and images. Interactivity acts as a "thumb-stop" mechanism. When a user realizes they can influence the content on the screen, their attention span resets, and they are more likely to engage deeply with the material.
The Psychology of Dual Coding Theory
The effectiveness of interactive visuals is rooted in Dual Coding Theory , a framework proposed by Allan Paivio. The theory suggests that the human brain processes verbal and visual information through separate channels. When you present data that requires both looking (visual) and interacting (physical/verbal), you create multiple cognitive paths for that information to be stored. Research highlighted by isEazy indicates that this multi-sensory approach significantly boosts long-term retention compared to reading text alone.
Managing Cognitive Load via Progressive Disclosure
One of the biggest challenges in data storytelling is the "saturation effect," where a user feels overwhelmed by too much information at once. Interactive infographics solve this through Progressive Disclosure . By hiding complex details behind clicks or hovers, you allow the user to master the basic concept before diving into the nuances. This manages the cognitive load, ensuring the reader never feels "lost" in the data.
Interactive Infographic Examples to Inspire Your Next Project
To understand the potential of this medium, we must look at how different industries apply these principles. From environmental awareness to corporate training, the applications are vast.
Narrative-Driven Experiences
A standout example is the "Underwater Scroll" by the ACS, titled "Take a Deeper Dive." As the user scrolls, the background changes to mimic the descent into the ocean. Specific marine life and data points appear at their respective depths. This use of "scrollytelling" creates a physical sense of scale that a static chart could never replicate. It transforms a list of facts into a visceral journey.
Data-Heavy Dashboards
For organizations dealing with massive datasets, the "Tabbed" approach is a top choice. The Europool layout, for instance, allows users to toggle between different countries or years within a single visual frame. This keeps the user on the page and prevents the need for multiple browser tabs, which is a major win for user experience (UX).
Educational & Corporate Training
The Missouri Case Study provides a fascinating look at interactivity in academia. The University of Missouri implemented interactive graphics on discussion boards to replace standard text prompts. Students could click through different scenarios and vote on outcomes, which led to a measurable increase in participation and peer-to-peer discussion. This demonstrates that interactivity isn't just for marketing; it's a powerful tool for pedagogy.
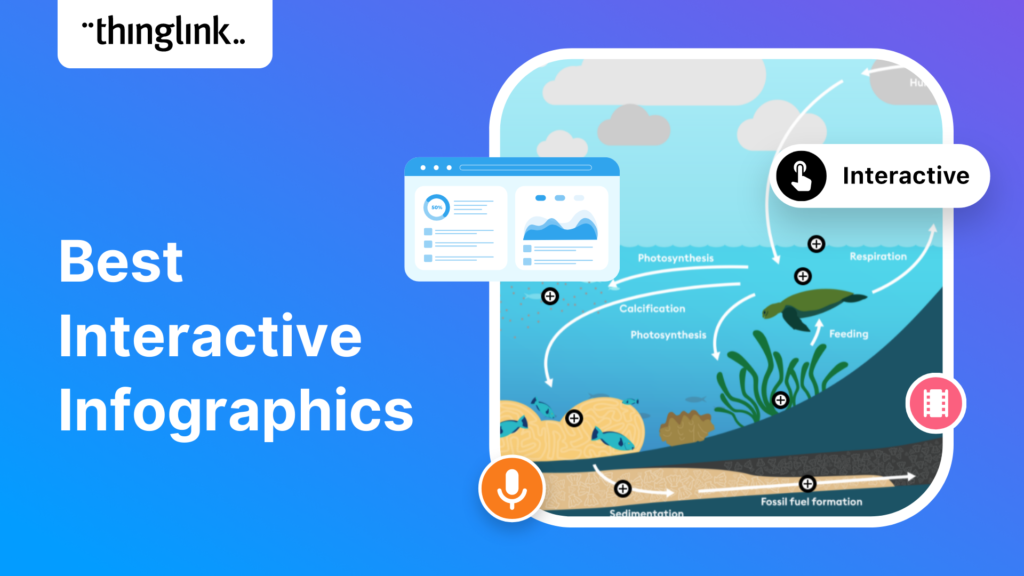
Image source: ThingLink
Which Tools Should You Use to Build Interactive Visuals?
The barrier to entry for creating high-quality interactive content has dropped significantly. You no longer need to be a master of D3.js or Three.js to produce professional results. The current market offers several no-code platforms tailored to different needs.
| Feature | Genially | Ceros | Maglr | isEazy |
|---|---|---|---|---|
| Best For | Educators & Small Biz | Enterprise Design | Professional Pubs | L&D Teams |
| Learning Curve | Low | High | Medium | Low |
| Key Strength | Extensive Templates | Creative Freedom | SEO Indexing | E-learning Focus |
| Mobile Support | Excellent | Advanced | Excellent | Good |
While tools like Genially are widely regarded as some of the most accessible for beginners, enterprise-level teams often gravitate toward Ceros for its "free-form" canvas. The choice ultimately depends on your technical comfort level and the specific goals of your project.
The Hidden SEO Benefits of Interactive Web Graphics
A common misconception is that interactive content is "invisible" to search engines. While this was true during the Flash era, modern HTML5-based infographics offer significant SEO advantages. Because the text is rendered as code rather than flattened into an image file, Google can crawl and index every word within your interactive layers.
Dwell Time and Engagement Signals
Search engines use dwell time (how long a user stays on a page) as a proxy for quality. Interactive infographics naturally extend this metric. When a user spends three minutes clicking through a data dashboard rather than thirty seconds glancing at a PNG, it sends a strong signal to Google that your content is valuable. This can lead to higher rankings for your target keywords.
Real-Time Analytics and Feedback
Unlike a static PDF, interactive modules provide granular data. You can see exactly which hotspots were clicked, which sections were ignored, and where users dropped off. This allows for a data-driven approach to content updates. If you notice users are ignoring a specific chart, you can redesign it in real-time without having to re-upload a new image file and lose your social share counts.
How to Design an Interactive Infographic Without Writing Code
Designing for interactivity requires a shift in mindset. You are no longer designing a "poster"; you are designing an "interface." Follow these steps to ensure your project is both beautiful and functional.
Step 1: The Function First Rule
Before adding a single animation, ask yourself: "If I remove this click, does the user lose information?" If the answer is no, the interaction is likely a distraction. Every hover and click should serve a purpose, whether it's revealing a definition, showing a trend line, or providing a deeper data layer.
Step 2: The 3-6 Rule for Cognitive Load
To maintain clarity, limit each interactive module to between 3 and 6 elements. For example, if you are using a pyramid structure for a leadership module, aim for 3 to 6 clickable levels. Exceeding this can lead to the "paradox of choice," where the user becomes paralyzed by too many options and ends up clicking nothing.
Step 3: The Two-Font Rule
For a professional look, stick to two fonts. Use one bold, decorative font for titles and a clean, highly legible sans-serif for body text. This is a standard recommendation from design experts at EBSCO . Consistency in typography helps the user distinguish between "navigation" text and "information" text.
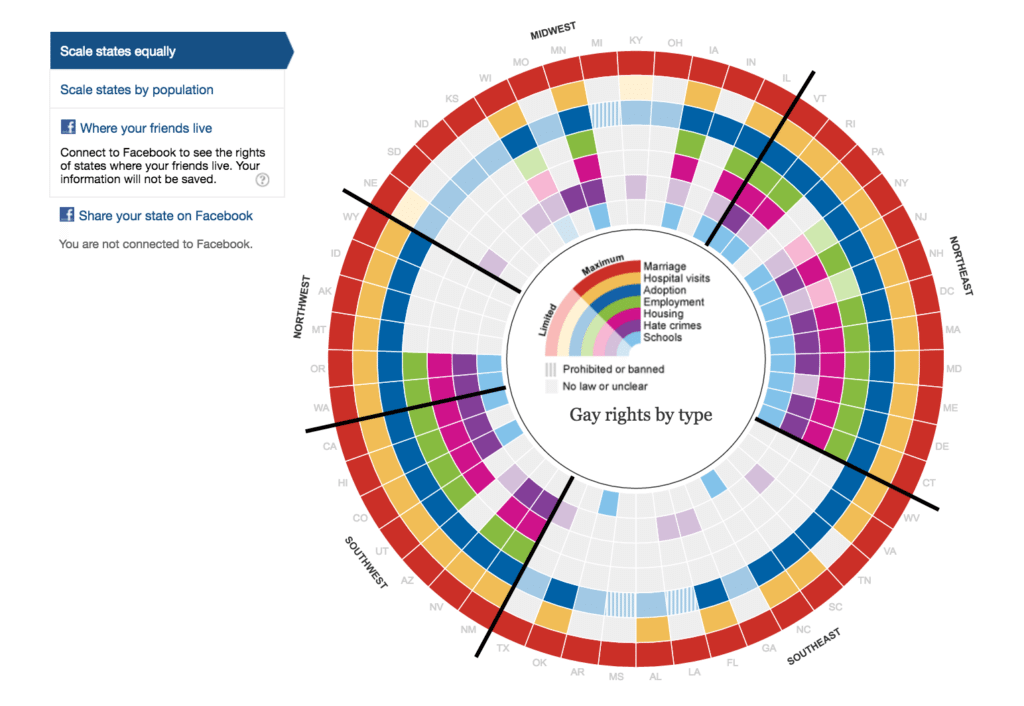
Image source: Column Five
Ensuring Your Interactive Content Is Accessible to Everyone
Accessibility is often an afterthought, but in 2026, it is a legal and ethical requirement. Interactive content presents unique challenges for users with visual or motor impairments, but these can be mitigated with proper planning.
- Contrast Check: Ensure your text-to-background contrast ratio is at least 4.5:1. Use tools like the WebAIM Contrast Checker to verify your palette.
- Keyboard Navigation: Every interactive element must be reachable via the "Tab" key for users who cannot use a mouse.
- ARIA Labels: Use "Accessible Rich Internet Applications" labels to describe what a button does for screen reader users (e.g., "Click to reveal 2025 revenue data").
- Mobile Responsiveness: Ensure that "hover" effects have a "click" fallback for touchscreens, as mobile devices do not have a hover state.
By prioritizing accessibility, you not only reach a wider audience but also improve the overall UX for everyone. A clear, high-contrast design is easier to read for a user on a mobile device in bright sunlight, just as it is for someone with low vision.
Frequently Asked Questions
Key Takeaways for Your Next Interactive Project
- Prioritize user agency by ensuring every interaction provides meaningful new information.
- Combat scroll fatigue by using "scrollytelling" to pace your narrative effectively.
- Leverage Dual Coding Theory to improve audience retention through visual and physical engagement.
- Select the right tool based on your specific needs, whether it's Genially for ease of use or Ceros for creative freedom.
- Optimize for SEO by using web-based platforms that allow search engines to index your data layers.
- Maintain accessibility by checking color contrast and ensuring mobile responsiveness.
- Use the 3-6 rule to manage cognitive load and prevent user overwhelm.
Start by identifying a single complex dataset in your current content strategy and experiment with a simple "hover-to-reveal" module to see how your engagement metrics respond.
-
Topic: Interactive infographic templateshttps://genially.com/templates/infographics/
-
Topic: 10 interactive infographic examples that will inspire youhttps://www.ceros.com/blog/interactive-infographic/
-
Topic: 12 interactive infographic examples and what makes each ...https://www.maglr.com/blog/infographic-examples

How to Build a Profitable Millennial Digital Planner Side Hustle from Scratch
Build a digital planner side hustle. Learn niche ideas, design workflows, and Etsy strategies for 2026. Earn passive income with our expert guide.


How to Find and Use the Thumbs Up Icon for Design and Code
Get free thumbs up icons in SVG and PNG. Learn copy-paste shortcuts, UI design best practices, and how to avoid passive-aggressive emoji use.


How to Use Crossword Labs to Create and Share Free Puzzles
Learn how to use Crossword Labs to create, print, and embed puzzles for free. Includes AI prompts, Canva design tips, and advanced URL hacks.